Connor Boyle
I Found Out I'm Colorblind, So I Made a Program to Generate Images That I Can't Read
by Connor Boyle
tags: softwarecolorblindness
After realizing I was mildly colorblind, I made this program to generate colorblindness tests
I recently (read: several months ago) watched a video about so-called “color-corrective lenses” that supposedly enable colorblind people to see the full range of colors that people with full color vision can see. The video’s creator argues—successfully, in my opinion—that these color corrective lenses are essentially a scam. They cannot restore full color vision, and only assist in distinguishing pairs of colors by entirely blocking the light of one of the colors. They may have some practical use, but only at significant cost; for example, green traffic lights may appear completely black, as occurred for one reporter who tried on the glasses and drove his car (!!!) with them on.
What really got my attention was the video creator showing some of the colorblind tests that he, a colorblind person, had tried and failed. These tests—known as Ishihara test plates—consist of circles filled with irregularly sized and placed dots I noticed that I too often could not read these test plates. Somewhat alarmed, I took several online colorblindness tests (including one furnished by a color corrective lens company). These tests generally indicated that I had mild deutan colorblindness. The cone receptors in my retinas that should be activated by green light are lacking in quantity or quality, and therefore my ability to distinguish red from green is significantly worse than someone with full color vision.
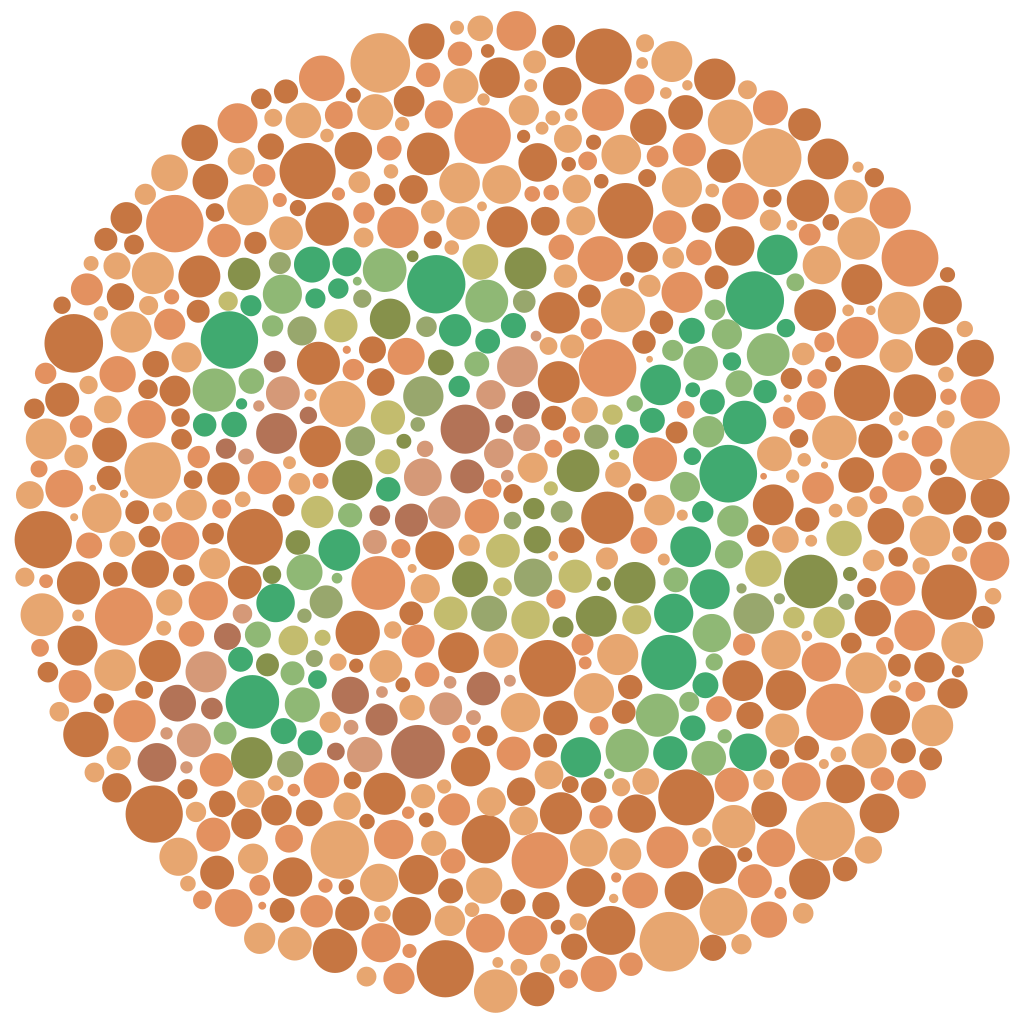
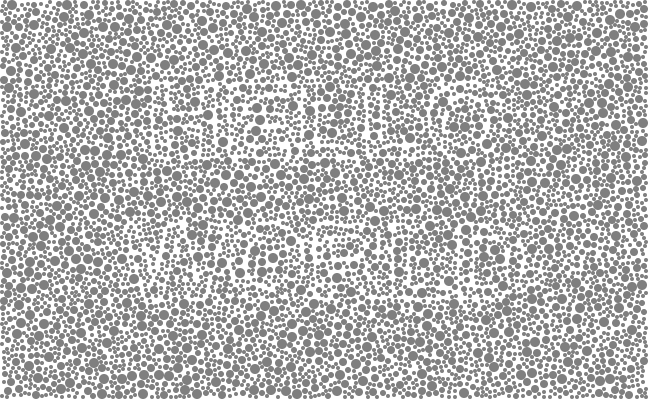
An example of an Ishihara plate, showing "74" in green dots surrounded by orange dots (from Wikipedia)
I was particularly shaken when I showed one of the Ishihara test plates to my friends & girlfriend. The plate above is the number 74 in green dots surrounded by orange dots; my friends & girlfriend told me they could easily perceive it as 74. This 74 was not (and still isn’t) clear at all to me! I can see that there’s a number, but I originally thought it might be a 21, and still can’t help but see it as a 21 sometimes.
I became fascinated with Ishihara test plates and things like them (see above). I tried a few programs that I found to make my own Ishihara plates but none of them quite satisfied me in terms of power and customizability, so I decided to make my own using Rust and WebAssembly. This was my first time using WebAssembly, and I found the Conway’s Game of Life WASM tutorial very helpful, as well as Carl M. Kadie’s post Nine Rules for Running Rust in the Browser.
Creating the Algorithm
I decided to start with the simplest generation algorithm I could think of. First, we load the image as an array of
pixels; we decide which pixels in the image should be “in” versus “out” depending on whether the pixel has a luma value
greater or lesser than 0x7F (i.e. 127, or 50% of maximum illumination). Then we generate dots with random radii and
coordinates within the image. If a dot doesn’t overlap with any already-added dot, we add the dot to the image. The
dot’s color will depend on whether more than 50% of the pixels inside of it are marked as “on”; if so, it will be drawn
with the “on” color, otherwise it will be drawn with the “off” color.
This algorithm worked surprisingly well, except that it slowed down very quickly as the number of dots grew; total checks for overlapping dots grew quadratically with the number of dots, i.e. \(O(n^2)\). To cut down on required operations, I kept the added list of dots sorted by x-coordinate and used binary search to narrow down the list of dots to check for overlap to just those dots whose x-coordinate could possibly be in range of the new, candidate dot.
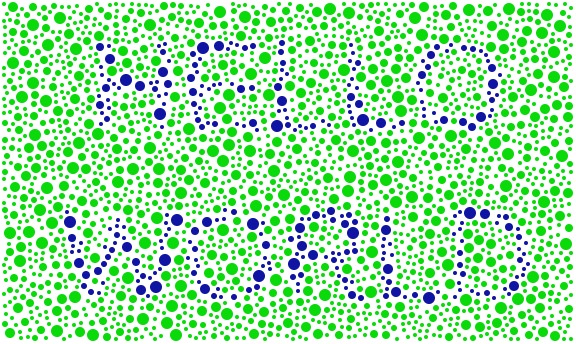
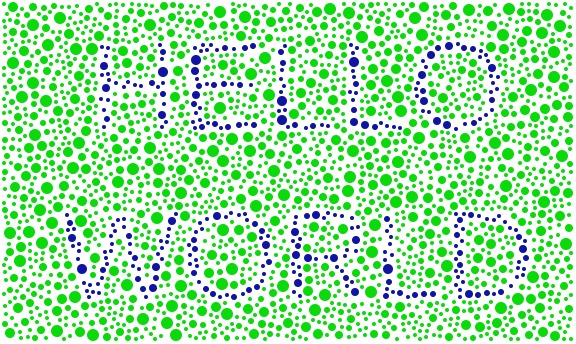
The text "HELLO WORLD", with (bottom) and without (top) a set maximum share of the dot's area that can cross the on/off boundary
I also noticed that the “in” and “out” dots sometimes crossed “in/out” boundary quite significantly, which made the outline of the text or number represented unclear. To make up for this, I added a user-set “tolerance” parameter, which defines the maximum share of a dot that can contain pixels of the “wrong” on/off value.
Playing with the Ishihara Generator
I still don’t have a good pipeline for generating the black-and-white text images to use as input for the Ishihara test generator; my quick-and-dirty solution is to make a Google Doc with very large font bold text and take a screenshot of that. I’ve noticed that if you set padding (the minimum space between dots) and tolerance very low, you can end up with images where you can see the outline of text even with identically-colored dots:
Even without any coloring, you can sometimes see the outline of text if the tolerance parameter is set very low. Here, the tolerance is set to 0% and padding is set to 0
Technically, you don’t have to input a black-and-white image of text. It’s also fun to play around with wacky colors on any image with significant numbers of high-luma and low-luma pixels. For example, check out this cool visual output from a picture of an astronaut in Earth orbit:
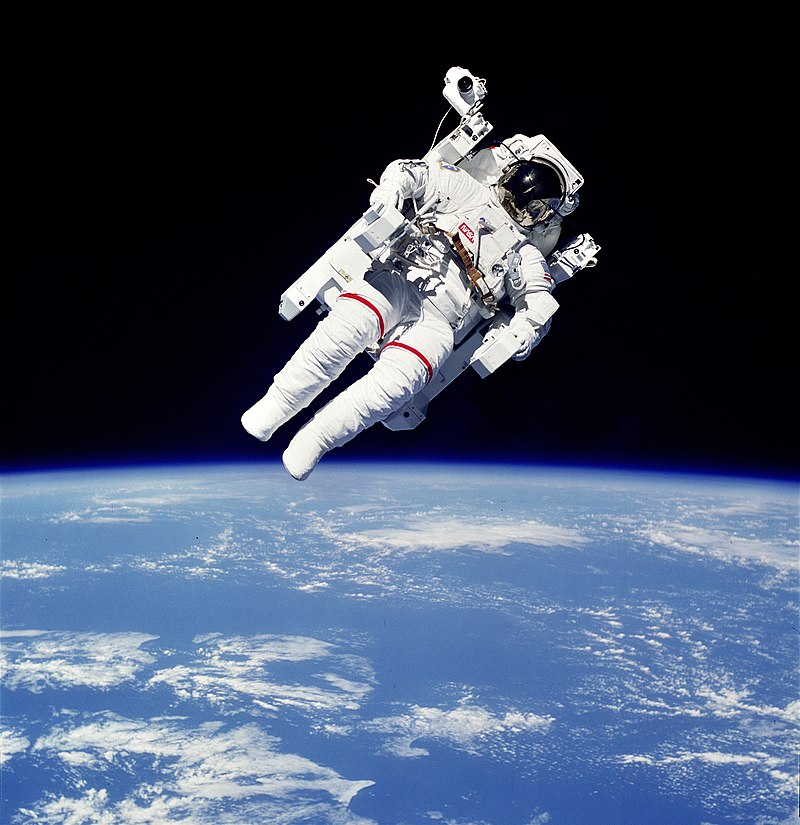
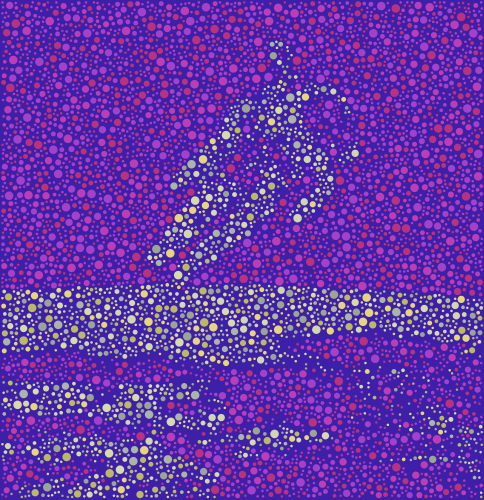
Trippy!
Here’s the link to my program that I used to make all these images. The only thing you should need to use it is a modern web browser. Thanks to the power of WebAssembly, computation happens on the client-side, so you don’t even need a persistent network connection.
tags: software - colorblindnessFind me on:
Blog posts:
Hosted on GitHub Pages — Theme by orderedlist